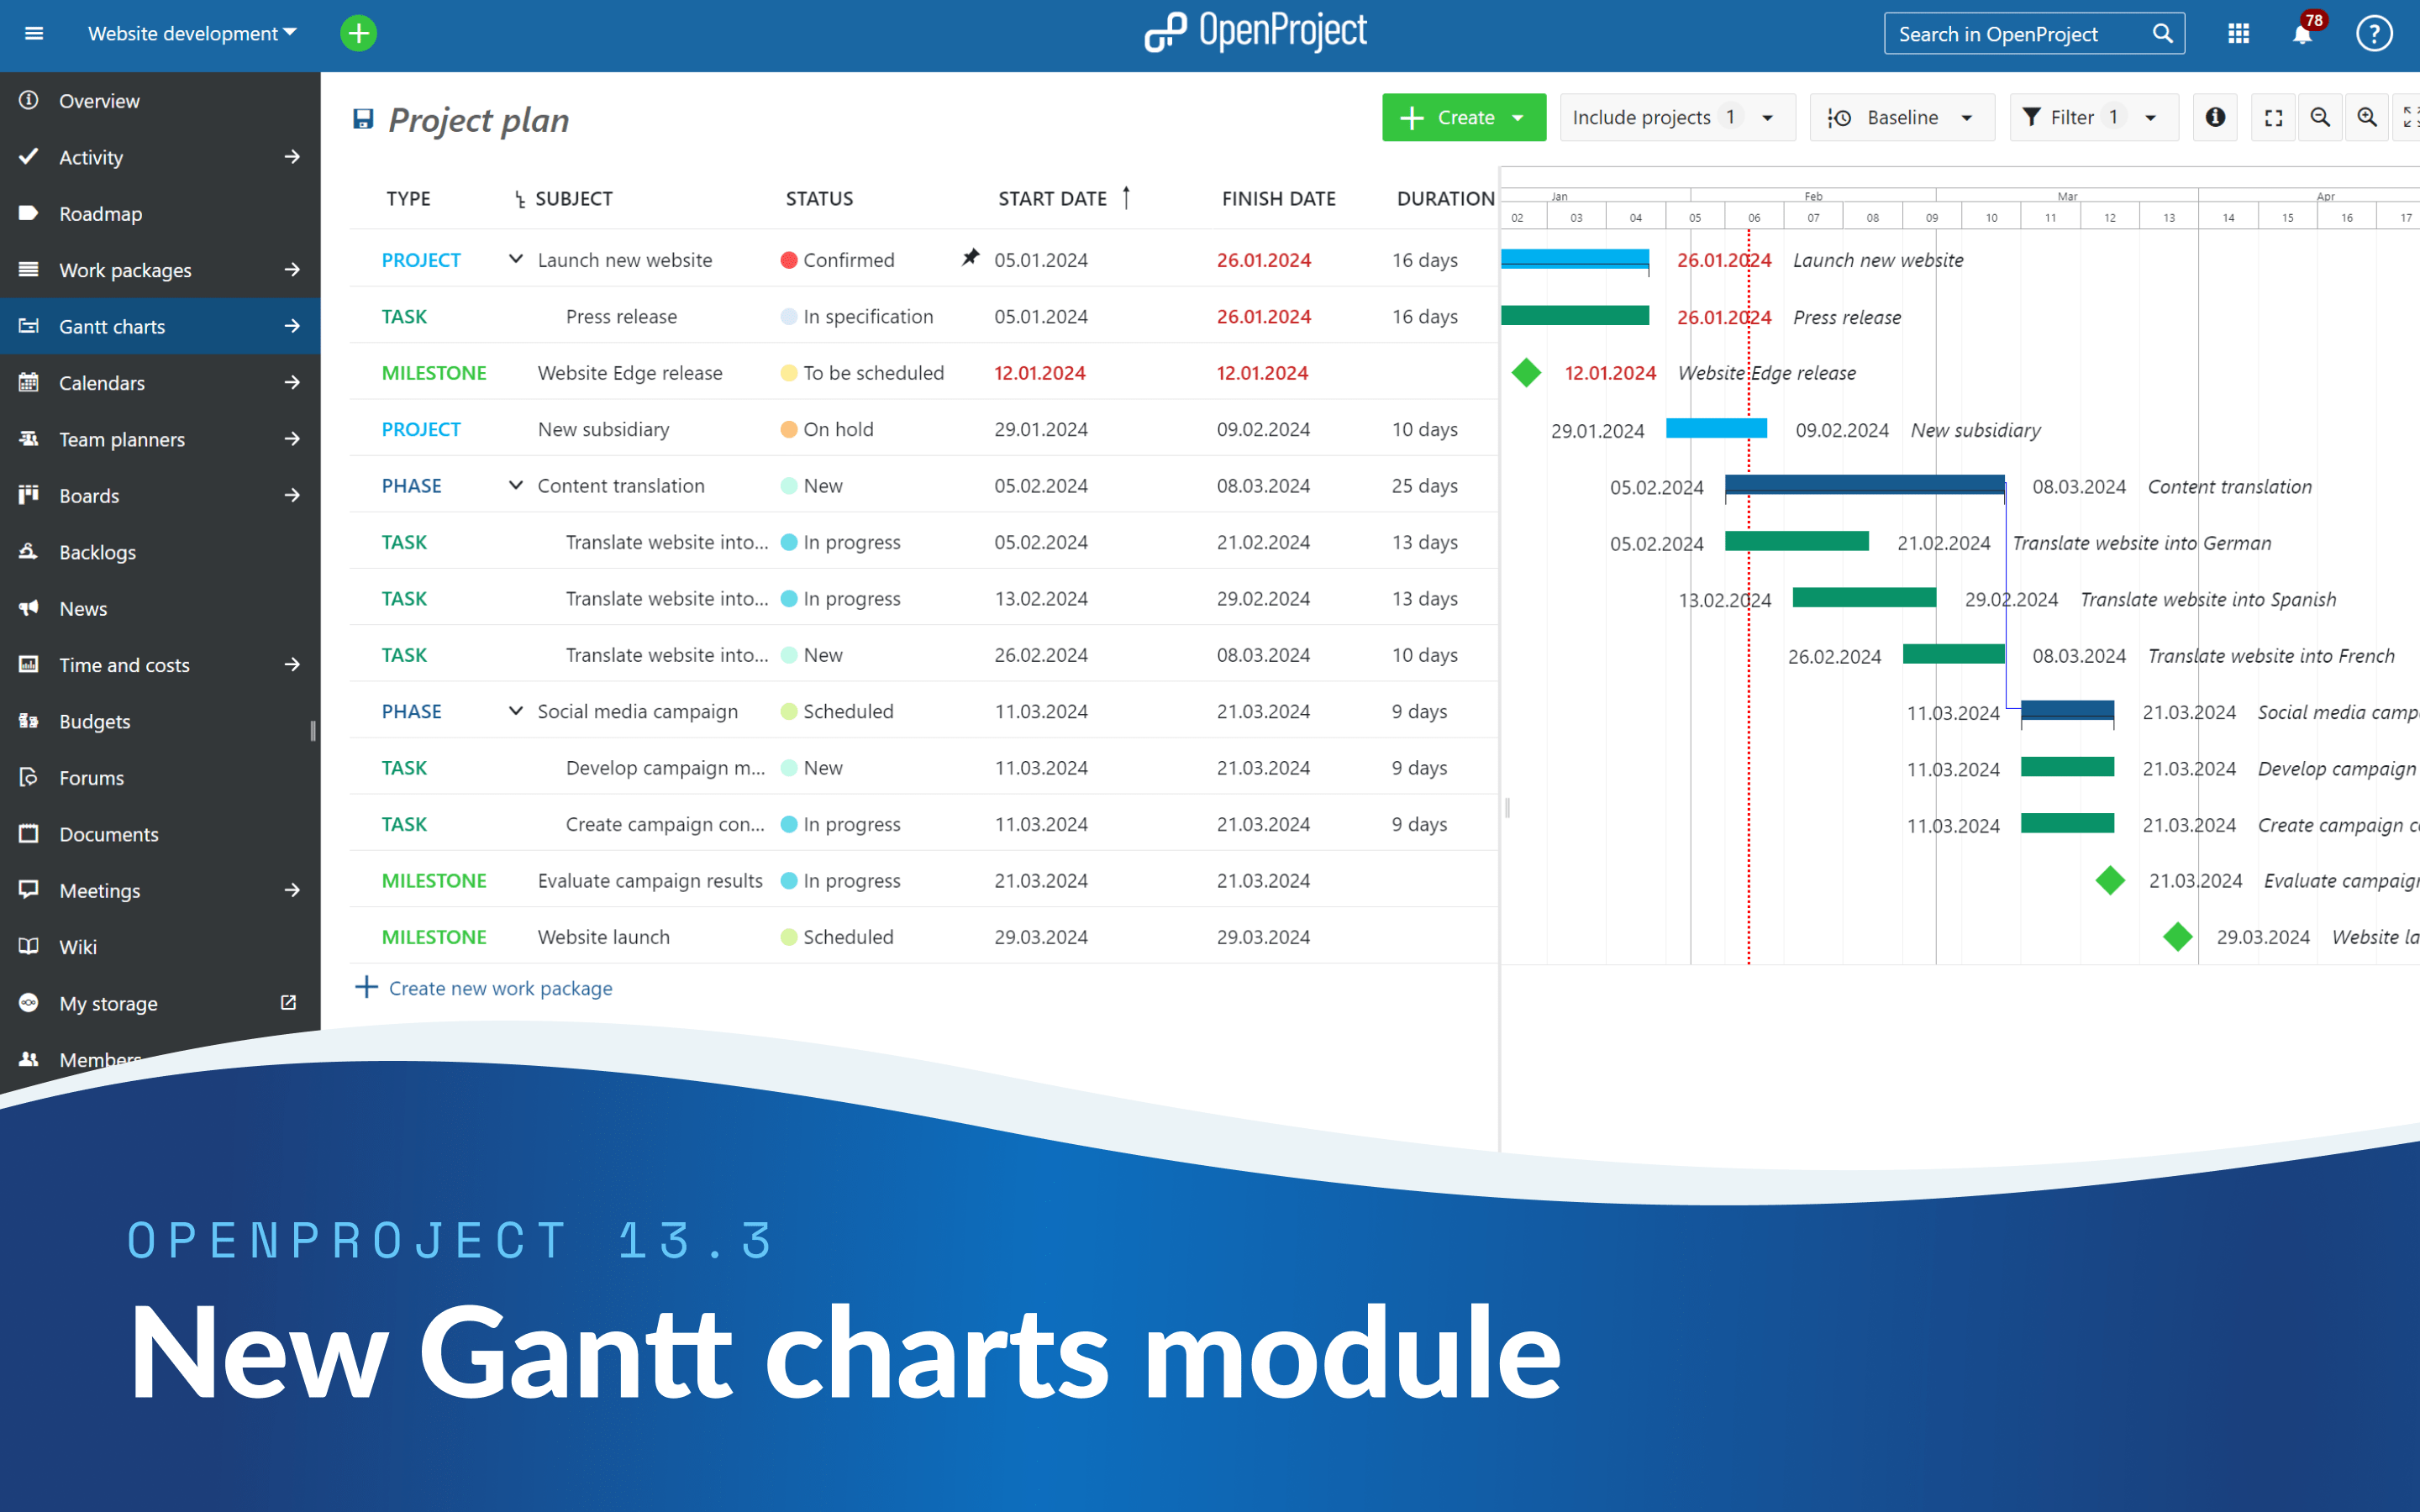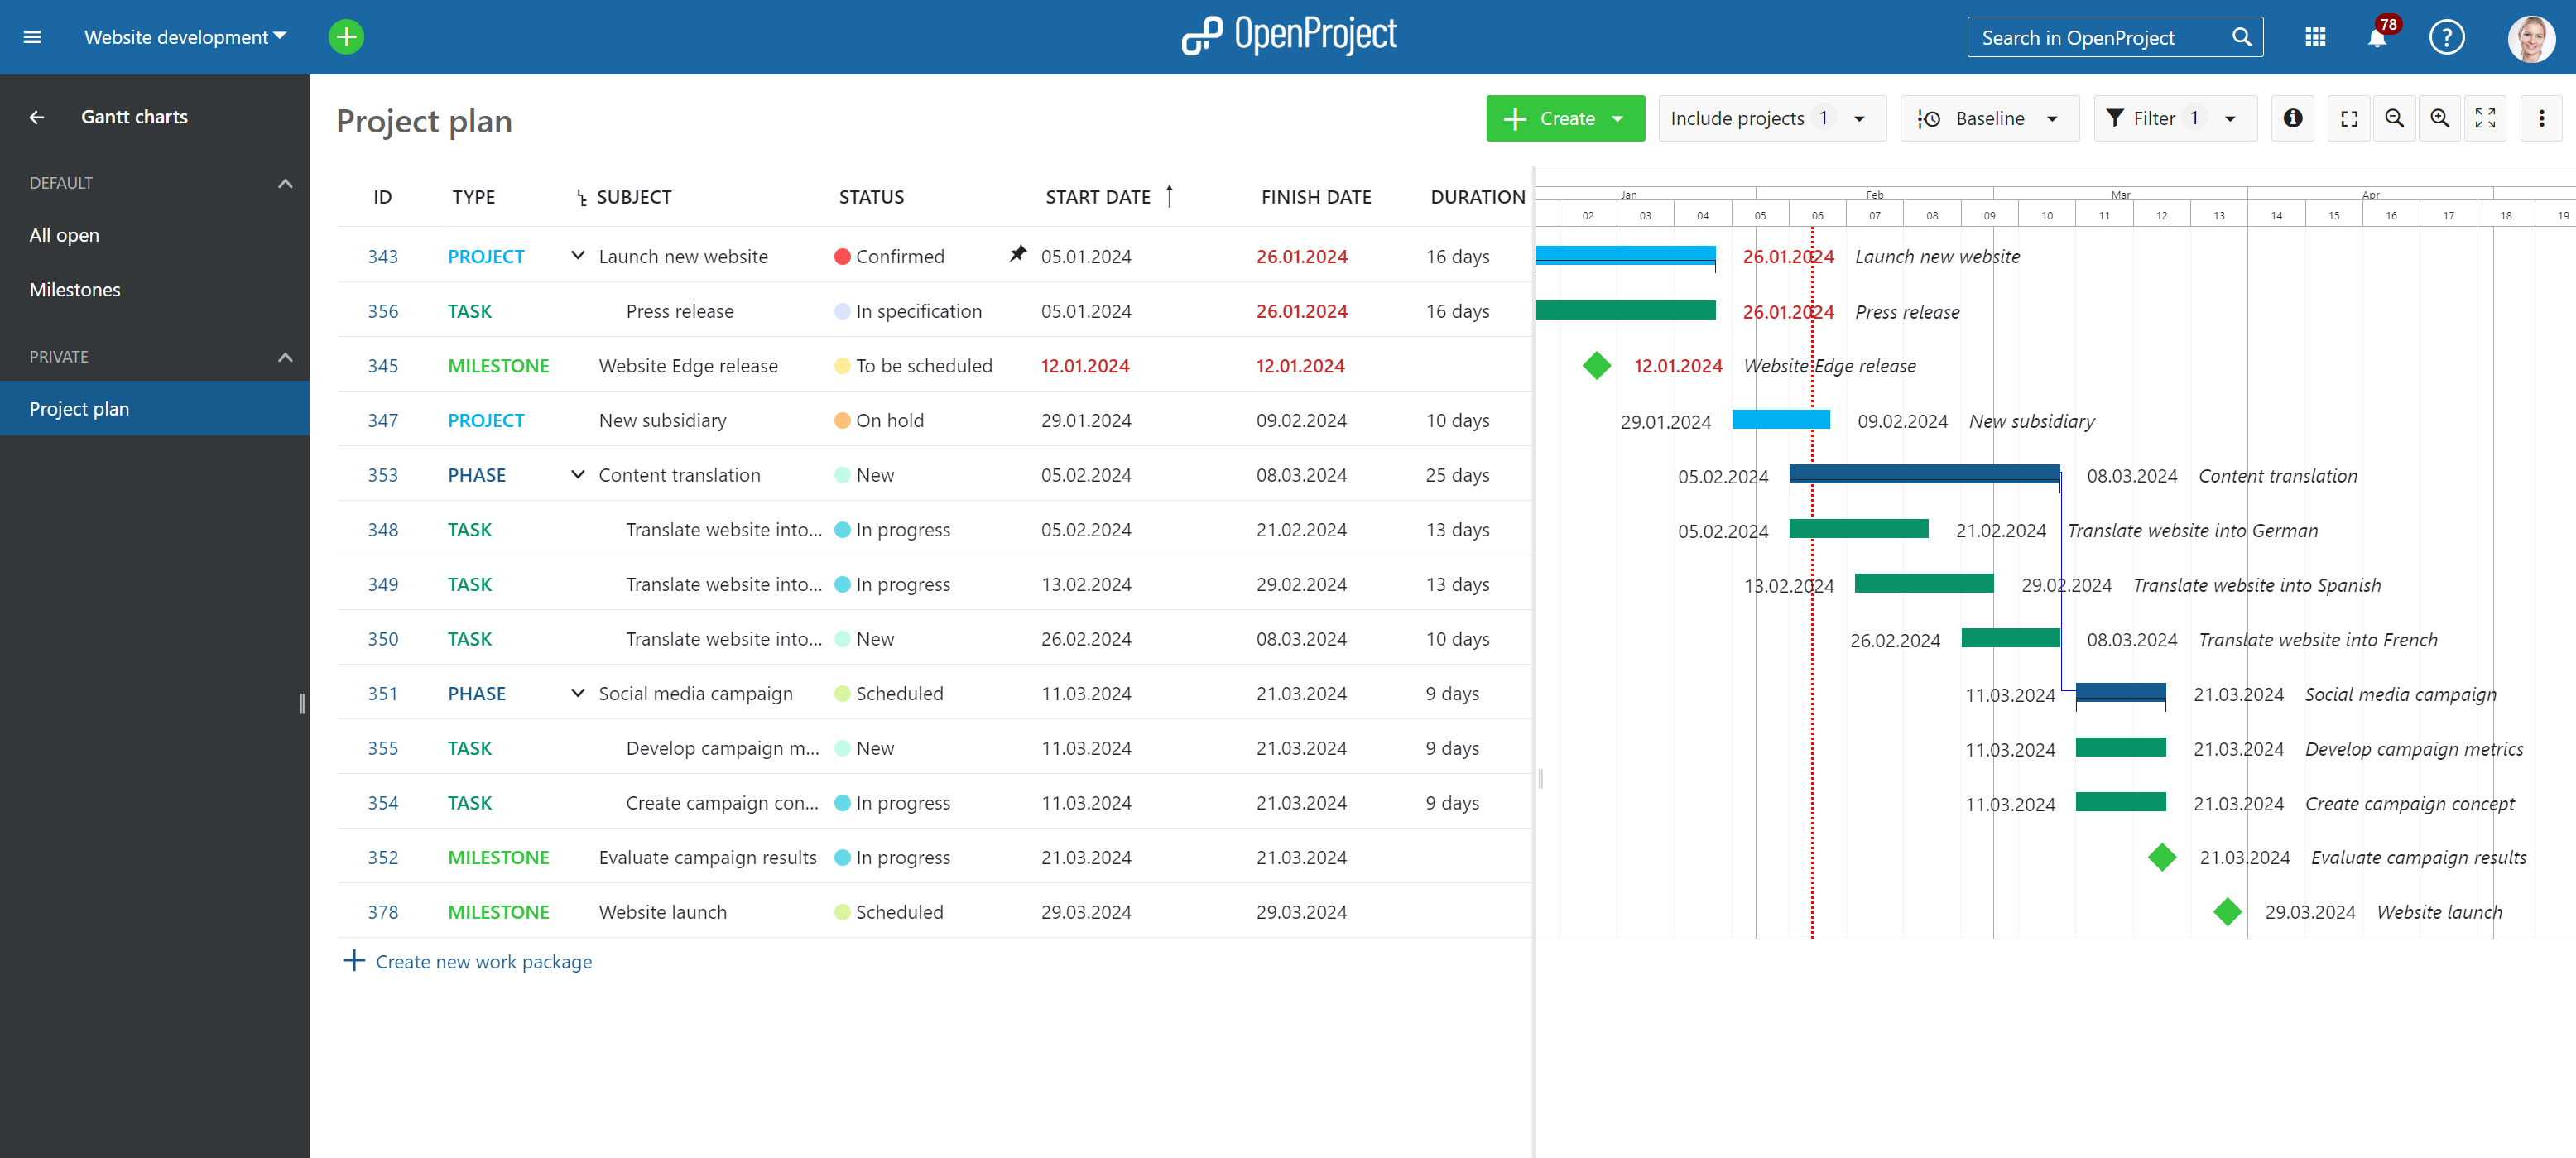
Separate Gantt charts for more clarity and better organization
In the past, Gantt charts in OpenProject were always part of the Work Packages module. Although they are an essential and very central aspect of project management and therefore also an important feature of the OpenProject application, they were hidden behind a drop-down button in the work package list. Many users were not even aware that there were Gantt charts for creating project plans and timelines. With the upcoming release of OpenProject 13.3, scheduled for 14th February 2024, we will now introduce a new separate Gantt charts module.
What did our users tell us?
We have had many conversations with users and customers and have come to the conclusion that the vast majority always either work in the work package view (with various filters) or have created dedicated filters for project planning, which often include other types such as phases and milestones and display the Gantt chart. We didn’t actually hear very often that a quick switch between the different views was used very often, which is what the button in the work package list was designed for. Rather, it was either the project planning that was important or the actual work packages (tasks, features, bugs) in a project. That gave us a good impression that many users actually need either - or, but not both features at the same time switching between them.
What will be changed with the new Gantt charts module?
These findings made us decide to have two modules after all. Also, because it was often difficult to understand why a user had to activate a Gantt chart within the work package module via a button. With 13.3 the Gantt charts view will be moved to a separate module in the project menu (and Gantt charts will always be activated). We will remove the drop-down button to activate the Gantt charts in the regular work packages list view.
Please note: All saved filter queries that contain an activated Gantt chart and were previously saved in the Work packages module are automatically moved to the new Gantt charts module.

Further advantages of two different modules
More clarity and better organization: A separate Gantt chart module helps provide a more structured and intuitive way of navigation through the product, allowing users to switch between task management and timeline visualization in Gantt charts via the project menu and not having both combined in one menu. No cumbersome search or navigation across work packages is required anymore.
Better user experience: By separating the Gantt charts from the work package list, the user interface can be simplified, making it easier for users to find their way around and focus on specific aspects of project management without being overwhelmed by too much information on one screen - either for working with task, features or any other work packages or by creating a project timeline, planning and scheduling. In project management these tasks are separated from each other.
Customization: A separate Gantt chart module allows for more specific customization options regarding the display of timelines, e.g. filtering of types, attribute highlighting, task grouping and default views.
Discoverability: For new or occasional users, a separate Gantt chart module is easier to find and use as it displays the complex task of schedule management separately from the rest of the project management activities (other tasks in the project).
Access to the new Gantt chart module via the global menu
Furthermore, it is no longer necessary to select a project to create, edit or view a Gantt chart. The new module is now also easily accessible via the global menu and enables quick access to the project planning and scheduling. For the digitally sovereign workplace - openDesk - this is a significant simplification to access the project timelines and schedules.
Further development of specific features for project planning and scheduling
The new Gantt charts module allows us to further extend the module with features that are only relevant for Gantt charts and project planning, for example with a critical path view, with better creation and editing of dependencies, or with the consideration of buffers (constraints).
With the new Gantt chart module, we want to create a genuine open source alternative for project management with Microsoft Project and have now laid the foundations for extending the Gantt charts with relevant project management features.
This change will certainly take some time getting used to. We hope you will give it some time and test how the new menu navigation feels for you. We are looking forward to hearing your feedback and to a critical exchange with you.


